

CASE STUDIES / ORIGINATION · AUG 2024
Choosing supply under demand and route uncertainty.
The study compares Australian and Middle Eastern supply in an expanded LNG portfolio.
$530.4M
PROFIT RANGE ACROSS TESTED TTF PRICE SCENARIOS
Expand the reference portfolio.
01 · PORTFOLIO
The initial portfolio ships 22 Sabine Pass cargoes to Gate on two vessels. The expanded model adds northwest European supply, Portuguese and Korean demand, and four new supply cargoes.
EXPANDED REFERENCE PORTFOLIO
- 22 Sabine Pass cargoes to Gate: 115% HH + $3.5 tolling into 90% TTF
- Plus 4 DES purchases with NWE flex (90% TTF)
- Plus 4 DES sales at Sines (85% TTF) and 4 at Incheon (100% JKM)
- Fleet: 2 x 174K vessels + 1 TC-in
THE TWO SUITORS · 4 FOB CARGOES EACH
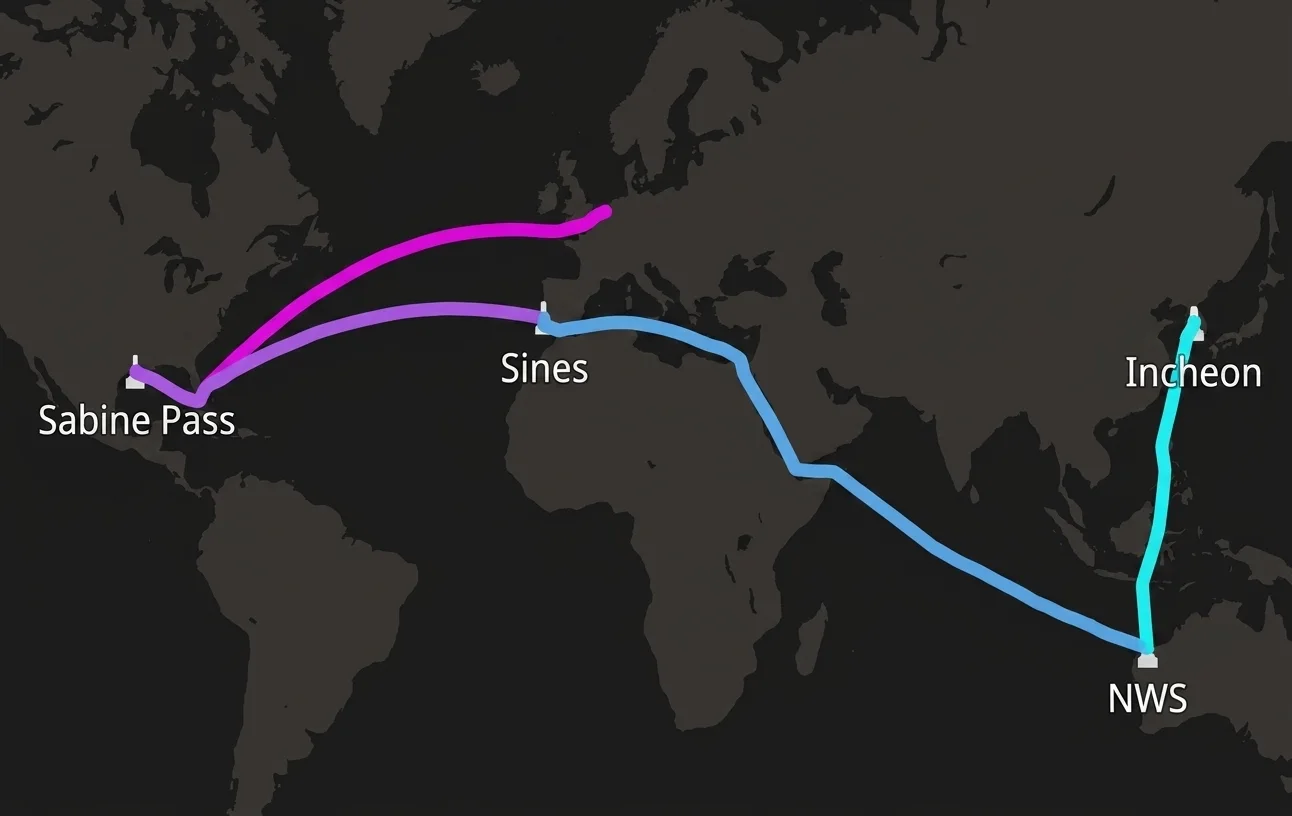
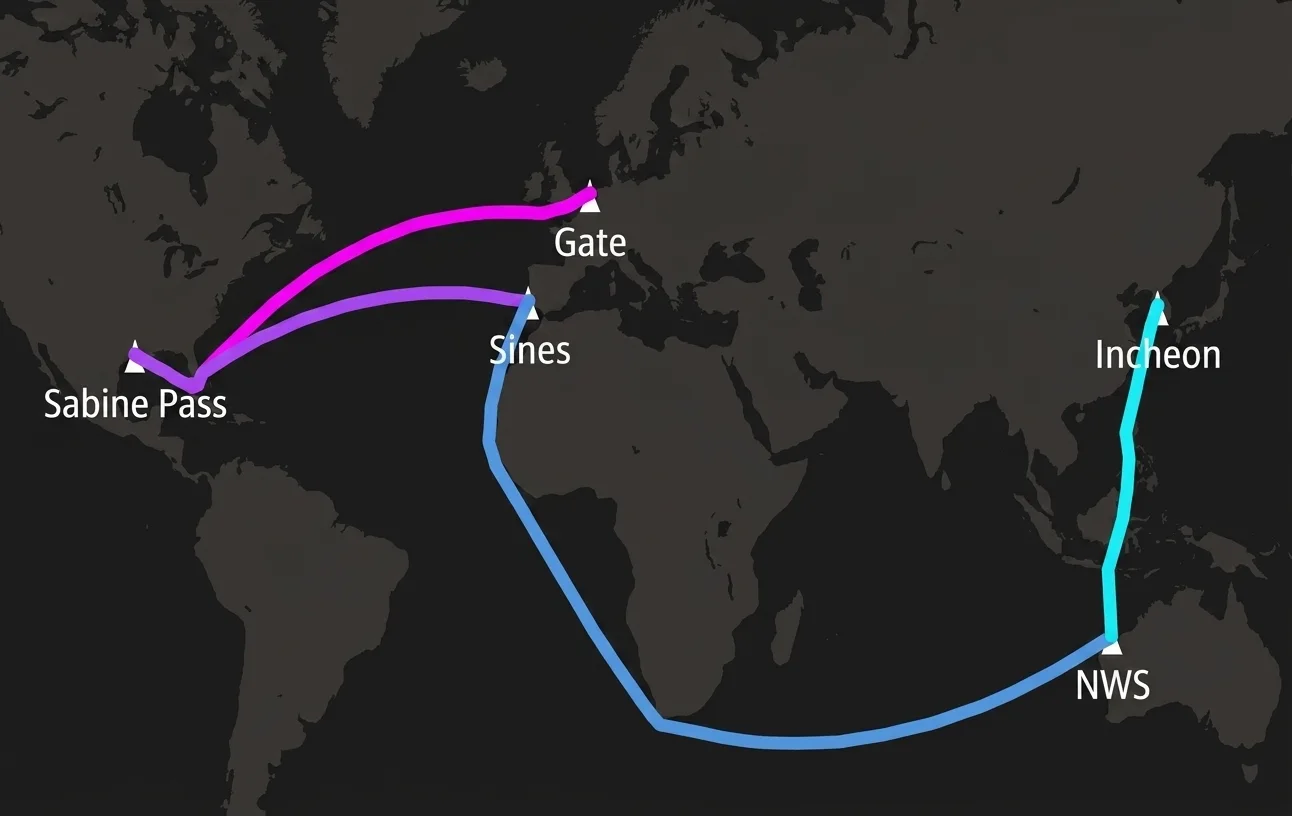
- Option A: North West Shelf, Australia, at 94.5% JKM minus $3.75
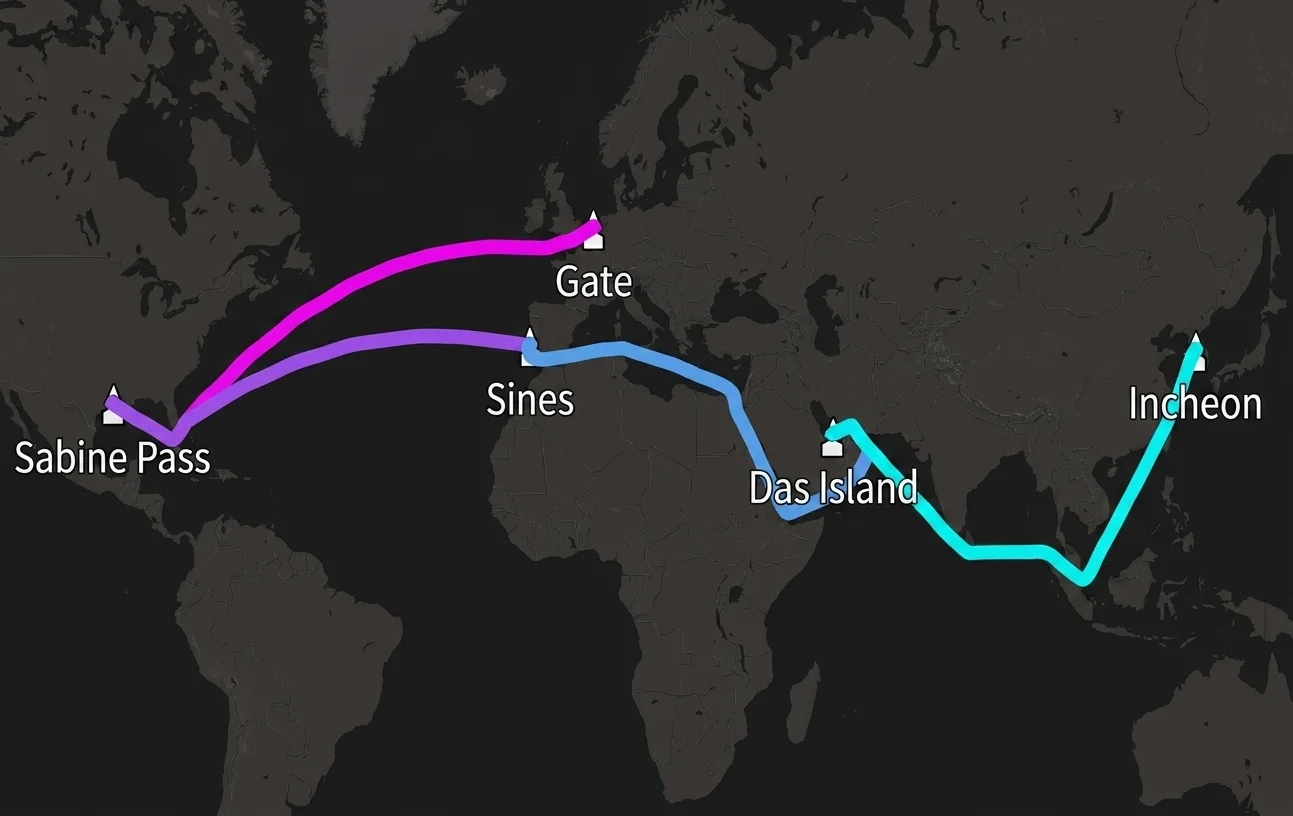
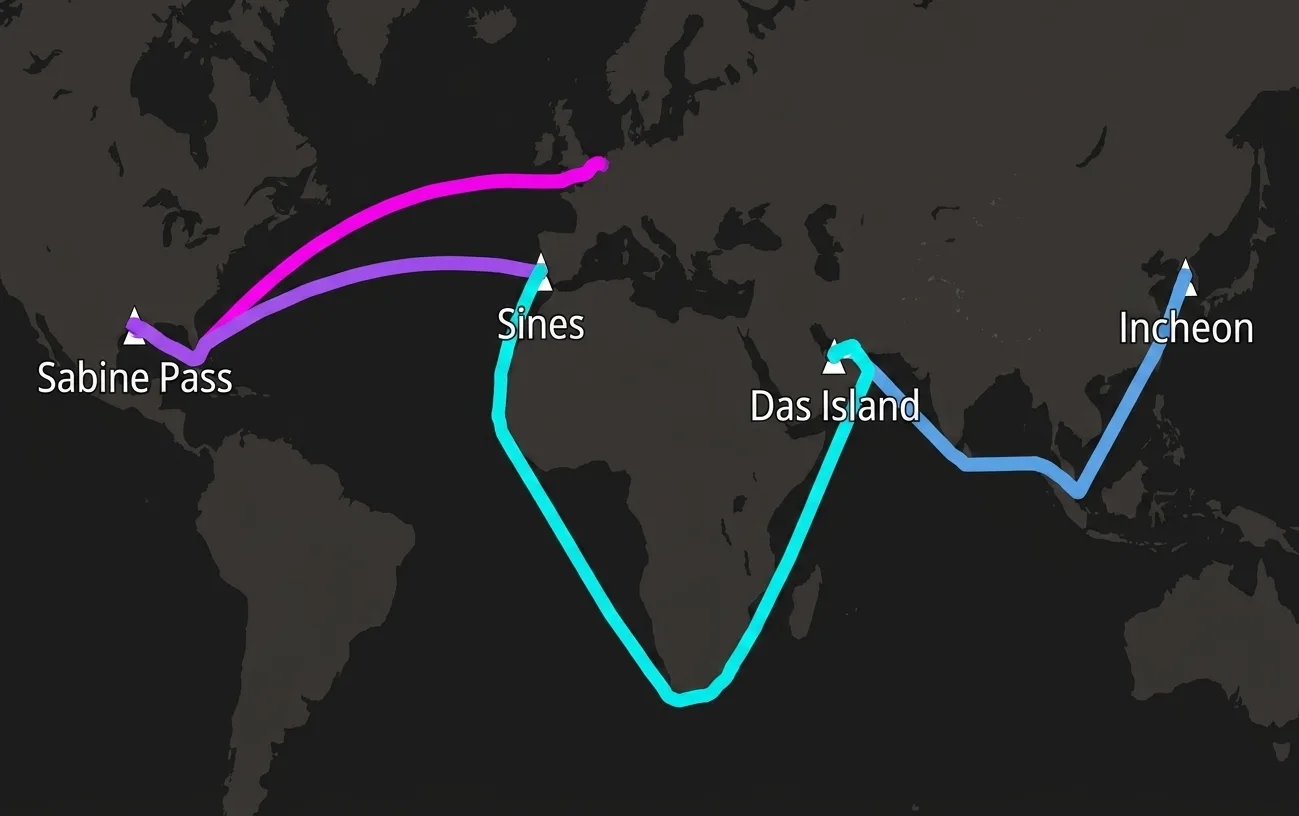
- Option B: Das Island, Middle East, at 11% Brent
- Same portfolio and demand; compare the two supply offers
FULL YEAR 2025 · FORWARD CURVES HH, TTF, JKM AND BRENT · OPTIMISED SCHEDULE PER SCENARIO
Compare the two sources.
02 · SUPPLY COMPARISON
Australian and Middle Eastern supply produce results within 2% under the initial assumptions. The study then varies demand timing, routes and prices.
Modelled profit: AUSTRALIA $273,208,244 · MIDDLE EAST $268,032,172 · BASE $238,435,281
Change the demand pattern.
03 · DEMAND SCENARIOS
Australian supply performs better in most tested demand patterns. The Middle Eastern option leads by $4.7M in the winter-skewed Korean demand case.
AUSTRALIA'S EDGE OVER THE MIDDLE EAST, PER SCENARIO · $M
DEMAND SKEWS AS 6-VS-2 CARGO SPLITS · Modelled profit: PORTUGAL-HEAVY $256,738,177 VS $249,420,655 · KOREA-HEAVY $287,963,212 VS $287,620,889 · SUMMER $245,019,585 VS $240,060,053 · WINTER $244,024,551 VS $248,678,414
Repeat the comparison with the Red Sea closed.
04 · RED SEA
In the Europe-heavy test, closure reduces Australian-supply profit by $4.6M and Middle-Eastern-supply profit by $3.9M. Both portfolios lose value, while Australian supply retains the higher total profit.
-$4.6M
AUSTRALIAN BOOK · $256.7M TO $252.2M
-$3.9M
MIDDLE EAST BOOK · $249.4M TO $245.5M
EUROPE
THE HIT LANDS WHENEVER EUROPE IS THE HEAVY SIDE
Compare supply choice with price exposure.
05 · VOLATILITY
The tested one-standard-deviation TTF range changes profit by $530.4M. This is a scenario range, not a realised loss or a VaR estimate. It exceeds the initial difference between the two supply choices.
PROFIT RANGE = ONE STD DEV ABOVE VS BELOW THE OPTIMISED VALUATION · STD DEVS YTD
06 · RESULT
A $530.4M profit range under the tested one-standard-deviation TTF variation.
The $530.4M is a range across the specified TTF scenarios, not a realised loss or a VaR estimate. Supply rankings depend on the demand profile and pricing formulas.
What this comparison shows.
07 · TAKEAWAYS
Compare the two sources
Australian and Middle Eastern supply produce results within 2% under the initial assumptions. The study then varies demand timing, routes and prices.
Compare supply choice with price exposure
The tested one-standard-deviation TTF range changes profit by $530.4M. This is a scenario range, not a realised loss or a VaR estimate. It exceeds the initial difference between the two supply choices.
Scope of the result
The $530.4M is a range across the specified TTF scenarios, not a realised loss or a VaR estimate. Supply rankings depend on the demand profile and pricing formulas.
How the study was calculated.
08 · CALCULATION
Set up the comparison
The initial portfolio ships 22 Sabine Pass cargoes to Gate on two vessels. The expanded model adds northwest European supply, Portuguese and Korean demand, and four new supply cargoes.
Calculate the alternatives
Australian supply performs better in most tested demand patterns. The Middle Eastern option leads by $4.7M in the winter-skewed Korean demand case.
Review the result
A $530.4M profit range under the tested one-standard-deviation TTF variation.
Modelled results depend on the contracts, prices and operating assumptions used.