

CASE STUDIES / RISK · NOV 2024
Comparing US Gulf and Mexican Pacific supply.
Two portfolios serve the same European and Japanese demand. The comparison tests open canals and a simultaneous Suez and Panama closure.
+$83.1M
PACIFIC SUPPLY VS US-ONLY · BOTH CANALS CLOSED
Two supply portfolios.
01 · PORTFOLIO
Both models use seven 174,000 m³ vessels to deliver 80 cargoes during 2025. One sources all cargoes at Sabine Pass. The other replaces 20 with Costa Azul supply.
SUPPLY 1 · US GULF
- 80 cargoes from Sabine Pass
- 115% HH + $3.5 tolling fee
- Everything crosses Panama or Suez to reach Asia
SUPPLY 2 · US GULF + MEXICO
- 60 cargoes from Sabine Pass, same terms
- 20 cargoes from Costa Azul, 120% HH + $3 tolling
- The Pacific coast reaches Asia without any canal
DEMAND: GATE SPOT AT 90% TTF MINUS $0.50 REGAS · FUTTSU SPOT AT 90% JKM · CANALS MODELLED FULLY OPEN OR FULLY CLOSED · FORWARD CURVES HH, TTF AND JKM
Compare profit in both canal scenarios.
02 · DISRUPTION SCENARIOS
Mexican Pacific supply adds $74.8M with both canals open and $83.1M with both closed. The same demand and fleet assumptions apply to both portfolios.
US GULF ONLY
$1,013.4M
CANALS OPEN · FULL-YEAR P&L
US GULF + MEXICO
$1,088.2M
CANALS OPEN · FULL-YEAR P&L
Modelled profit: OPEN $1,013,418,557 → $1,088,249,229 · CLOSED $992,984,431 → $1,076,062,599
Measure the disruption loss.
03 · RESILIENCE
Closing both canals reduces profit by $20.4M in the US-only portfolio and $12.2M in the diversified portfolio.
-$20.4M
US-ONLY CLOSURE HIT
-$12.2M
DIVERSIFIED CLOSURE HIT
+$74.8M
MEXICO UPLIFT · CANALS OPEN
+$83.1M
MEXICO UPLIFT · CANALS CLOSED
04 · RESULT
+$83.1M with Mexican Pacific supply in the closed-canal scenario.
The results apply to the selected prices, contracts, vessels and canal scenarios. They do not establish a general return for Pacific supply.
Check the revised destinations.
05 · CARGO ROUTES
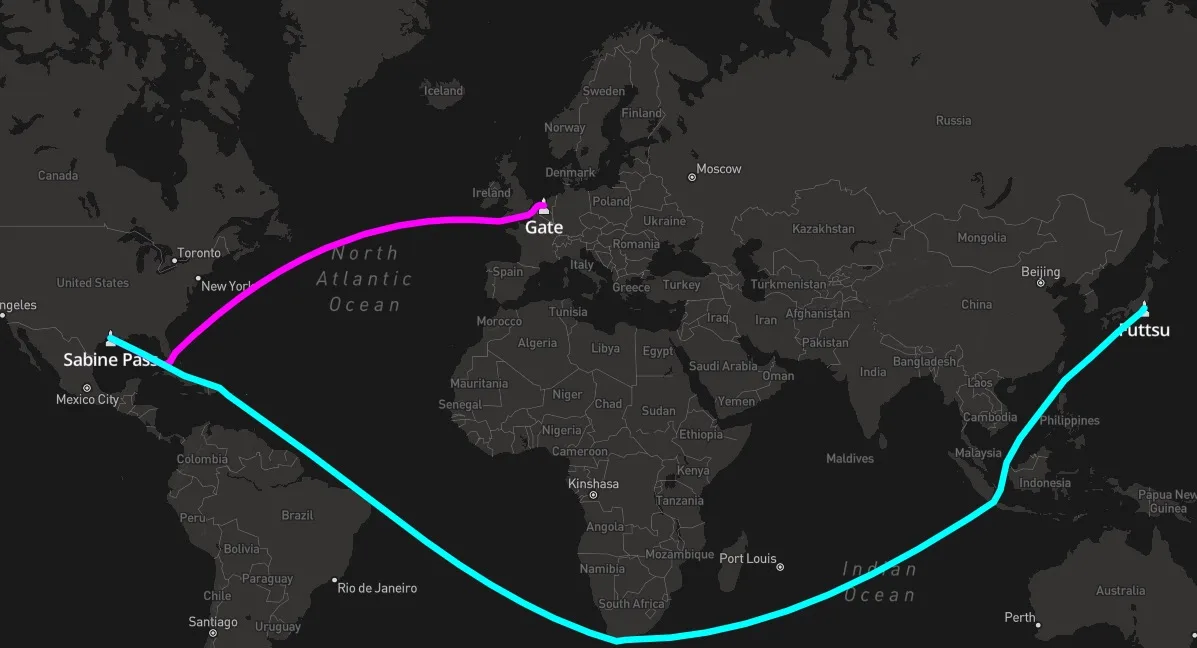
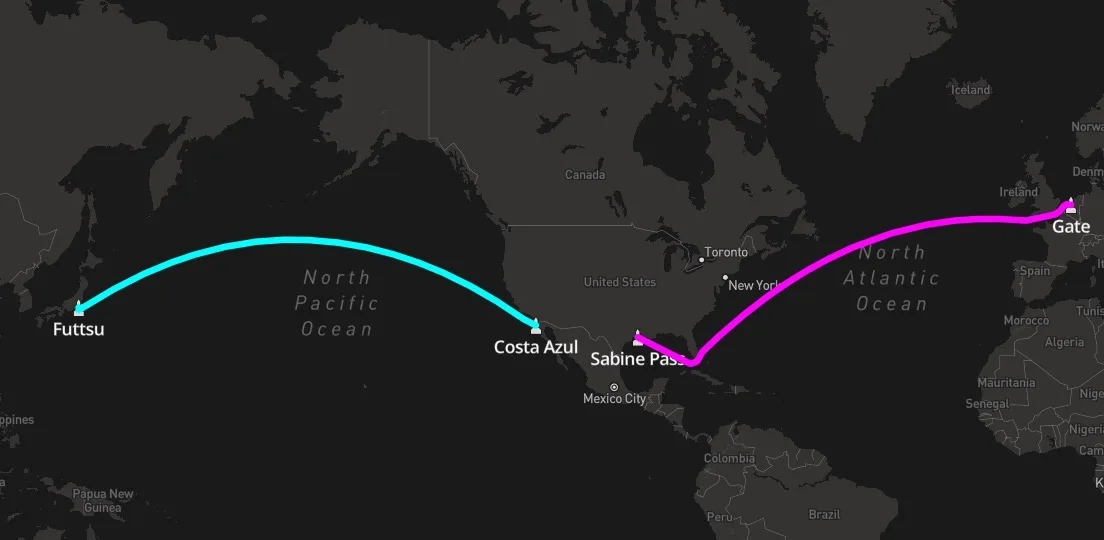
Under closure, the US-only plan sends 78 cargoes to Gate and two to Futtsu. The diversified plan sends all 20 Costa Azul cargoes to Futtsu and 60 Sabine Pass cargoes to Gate.
US-only supply, canals closed
The plan delivers 78 cargoes to Gate and two to Futtsu via alternative routes.
Pacific supply, canals closed
All 20 Costa Azul cargoes go to Futtsu. The 60 Sabine Pass cargoes go to Gate.
Both canals open
US-only supply delivers 70 cargoes to Gate and ten to Futtsu. The diversified plan delivers 57 and 23 respectively.
Inspect the cargo allocation.
06 · X-LNG RESULTS
The X-LNG views show the routes selected in each scenario. Compare which source serves Futtsu and how US Gulf cargoes are reassigned to Gate.
What this comparison shows.
07 · TAKEAWAYS
Compare profit in both canal scenarios
Mexican Pacific supply adds $74.8M with both canals open and $83.1M with both closed. The same demand and fleet assumptions apply to both portfolios.
Inspect the cargo allocation
The X-LNG views show the routes selected in each scenario. Compare which source serves Futtsu and how US Gulf cargoes are reassigned to Gate.
Scope of the result
The results apply to the selected prices, contracts, vessels and canal scenarios. They do not establish a general return for Pacific supply.
How the study was calculated.
08 · CALCULATION
Set up the comparison
Both models use seven 174,000 m³ vessels to deliver 80 cargoes during 2025. One sources all cargoes at Sabine Pass. The other replaces 20 with Costa Azul supply.
Calculate the alternatives
Closing both canals reduces profit by $20.4M in the US-only portfolio and $12.2M in the diversified portfolio.
Review the result
+$83.1M with Mexican Pacific supply in the closed-canal scenario.
Modelled results depend on the contracts, prices and operating assumptions used.