

CASE STUDIES / FLOWS · JUL 2025
Using 2023 LNG voyage data to model trade flows.
The study prepares a global LNG voyage dataset for supply, demand and shipping scenarios.
13 regions
HISTORICAL VOYAGE DATA GROUPED FOR SCENARIO MODELLING
Prepare the voyage data.
01 · VOYAGE DATA
The study excludes cargoes below 30,000 tonnes and flags voyages below 40% vessel utilisation. These filters aim to distinguish commercial deliveries from smaller or repositioning movements.
2023 GLOBAL VOYAGE DATA · IGU CONVERSION FACTORS · NON-COMMERCIAL MOVEMENTS REMOVED
Use consistent volumes and regions.
02 · THE MODEL
Cargo volumes are converted from tonnes to MMBtu using IGU conversion factors. The dataset groups origins and destinations into 13 regions.
30K T
COMMERCIAL THRESHOLD
3.6M
MMBTU PER STANDARD CARGO
13
REGIONAL CLUSTERS
2023
FULL VOYAGE DATASET
Compare export origins in the filtered dataset.
03 · EXPORTS
The displayed export shares are led by the US, Qatar and Australia. These describe the study dataset after filtering, rather than a forecast of future exports.
Compare destination shares in the filtered dataset.
04 · IMPORTS
The country table reports China at 23.0%, Japan at 19.4% and South Korea at 13.6%. Together, these entries total 56.0% of the displayed country-level imports.
COUNTRY-LEVEL SHARES IN THE FILTERED DATASET · CHINA + JAPAN + SOUTH KOREA = 56.0%
05 · RESULT
Commercial voyage data grouped into 13 regions.
This is a historical-data modelling study. A filter is an analytical rule, not proof that every excluded voyage was non-commercial.
Test a different supply or demand assumption.
06 · SUPPLY AND DEMAND SCENARIOS
Remove a supply source, change demand or restrict a route. Recalculate the fleet plan and compare cargo flows and vessel use with the reference case.
Remove a supply source
Recalculate routes after removing a source and compare the result with the reference dataset.
Change model inputs
Set the prices, terminal constraints and shipping assumptions for the scenario.
Increase demand by 20%
Compare vessel use, terminal flows and spot purchases under the tested demand increase.
Compare the revised plan
Review which cargo routes and vessel assignments change when the inputs change.
From observed voyages to a modelled schedule.
07 · X-LNG RESULTS
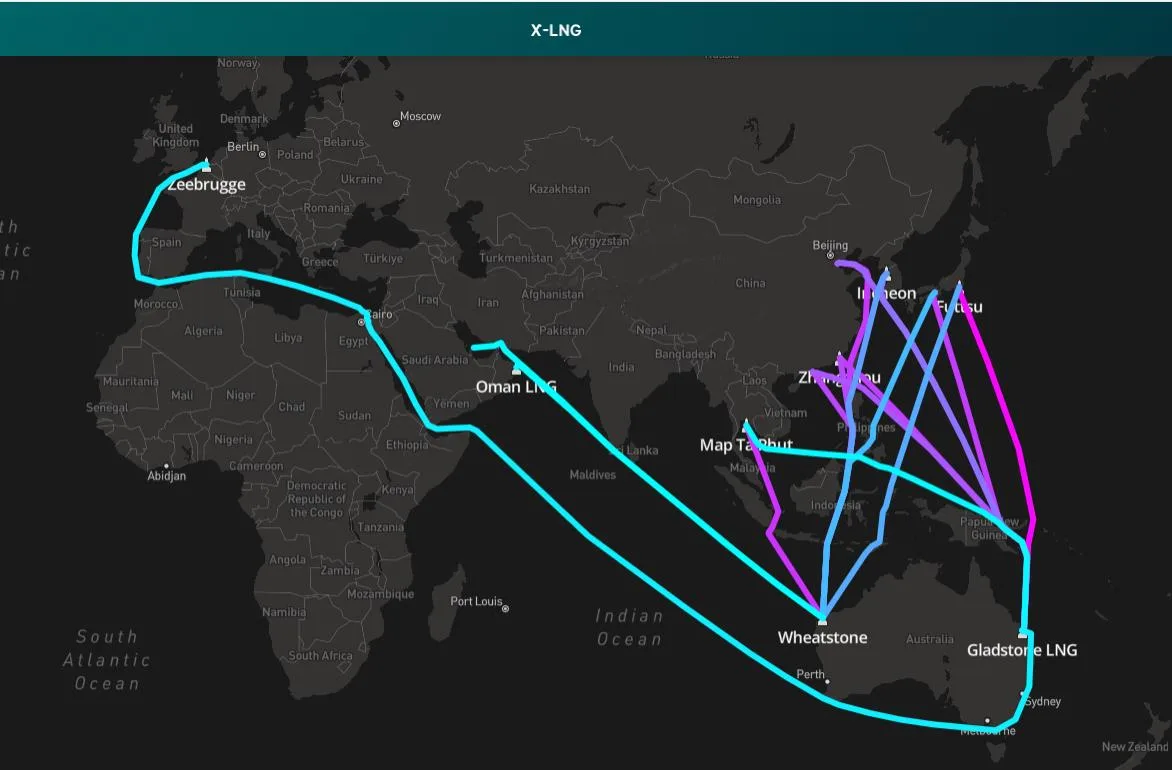
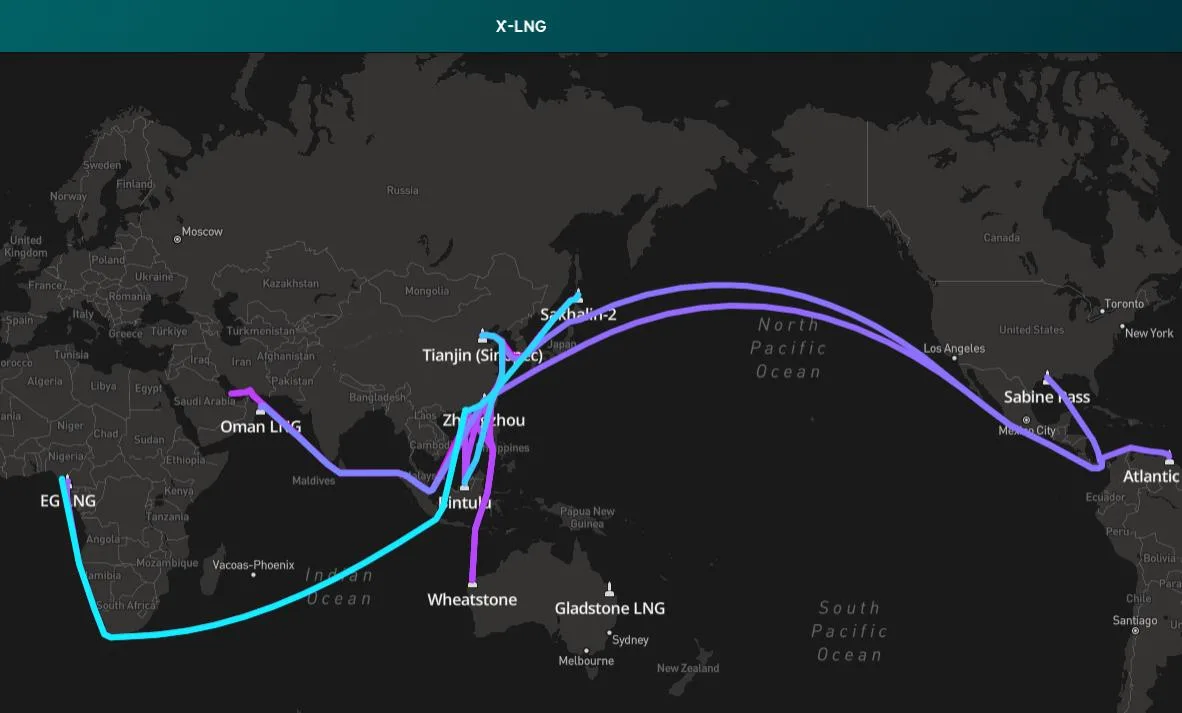
These X-LNG screens show the model outputs built from the historical dataset. Observed voyages provide inputs; the optimised flows are calculated outputs.
What this comparison shows.
08 · TAKEAWAYS
Use consistent volumes and regions
Cargo volumes are converted from tonnes to MMBtu using IGU conversion factors. The dataset groups origins and destinations into 13 regions.
From observed voyages to a modelled schedule
These X-LNG screens show the model outputs built from the historical dataset. Observed voyages provide inputs; the optimised flows are calculated outputs.
Scope of the result
This is a historical-data modelling study. A filter is an analytical rule, not proof that every excluded voyage was non-commercial.
How the study was calculated.
09 · CALCULATION
Set up the comparison
The study excludes cargoes below 30,000 tonnes and flags voyages below 40% vessel utilisation. These filters aim to distinguish commercial deliveries from smaller or repositioning movements.
Calculate the alternatives
The displayed export shares are led by the US, Qatar and Australia. These describe the study dataset after filtering, rather than a forecast of future exports.
Review the result
Commercial voyage data grouped into 13 regions.
Modelled results depend on the contracts, prices and operating assumptions used.